Title here
Summary here
July 1, 2021 in Programming11 minutes
These days there is an ever-growing list of tools and frameworks for working with eBPF, all at varying levels of abstraction. There does seem to be a few that sit at the core of the rest of the eBPF ecosystem. However, the ecosystem is changing rapidly, and I’ve found it to be a bit difficult to navigate through the sea of information that’s out there and understand which tools are the current “standard” for each use case, and which are being deprecated/changed. If you’re not totally plugged in to the linux kernel community, it may not be obvious where to start.
This post is really just a summary of the things I’ve learned going through this process, which is why there will be a ton of links to external resources that helped me.
Before we get into some of the developer tools, it’s worth looking at how a BPF program goes from source code to running program, as there are similarities with all of these tools as it pertains to a BPF program’s full lifecycle.
Clang is a very popular choice for compiling C/C++ code in general, and (even though there are other options these days) it is the de facto standard BPF compiler. When compiling a BPF program, one only needs to specify a target type of bpf. This is made possible by Clang’s use of LLVM, which has supported a BPF target since 3.7, released in 2015. This produces an object file containing BPF bytecode.
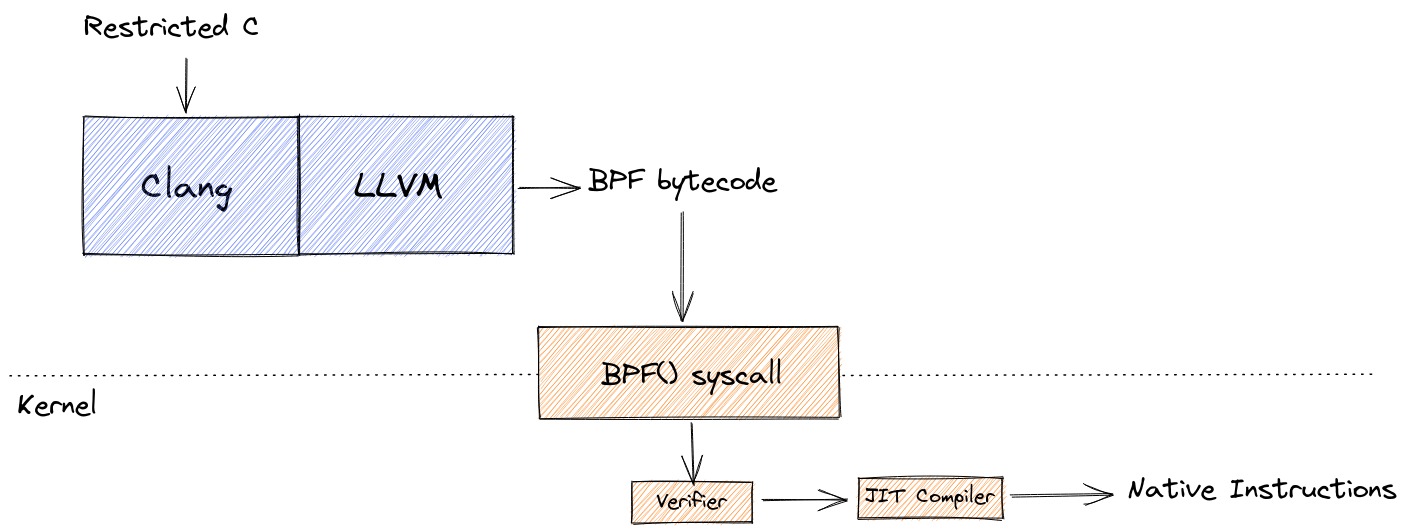
From there, the program must be loaded into the kernel for the final stage. This is done via the BPF() syscall. Here, the program is checked for correctness and safety by the verifier, and then finally the JIT compiler translates BPF instructions into native machine code.
The
BPF()syscall can actually perform a number of operations related to loading a BPF program, which I’ll cover in deep-dive in a separate post.
While it’s important to understand this lifecycle, it’s unlikely that you’ll need to directly compile BPF programs yourself in this manner. For the vast majority of real-world use cases, you’ll work with one of the tools or frameworks I explore in the sections below (or with an even higher-level abstraction built on top of one of them).
BCC is really the original framework that made it easier to write BPF programs. It includes libraries and tools for not only creating BPF programs but also the userspace components that can load these programs into the kernel, attach them to events like tracepoints or probes, and then interact with them further using shared resources like maps. The BCC project also contains numerous common, pre-built tools written using this framework that you can take off the shelf and use like any other command-line tool, without having to know anything about writing a BPF program.
For me, this is where I first started to see the terms “backend” and “frontend” used to describe the BPF program itself, and the user-space components that surround it:
Where “backend” always refers to a BPF program, BCC is only one choice on a growing list of front-ends to choose from.
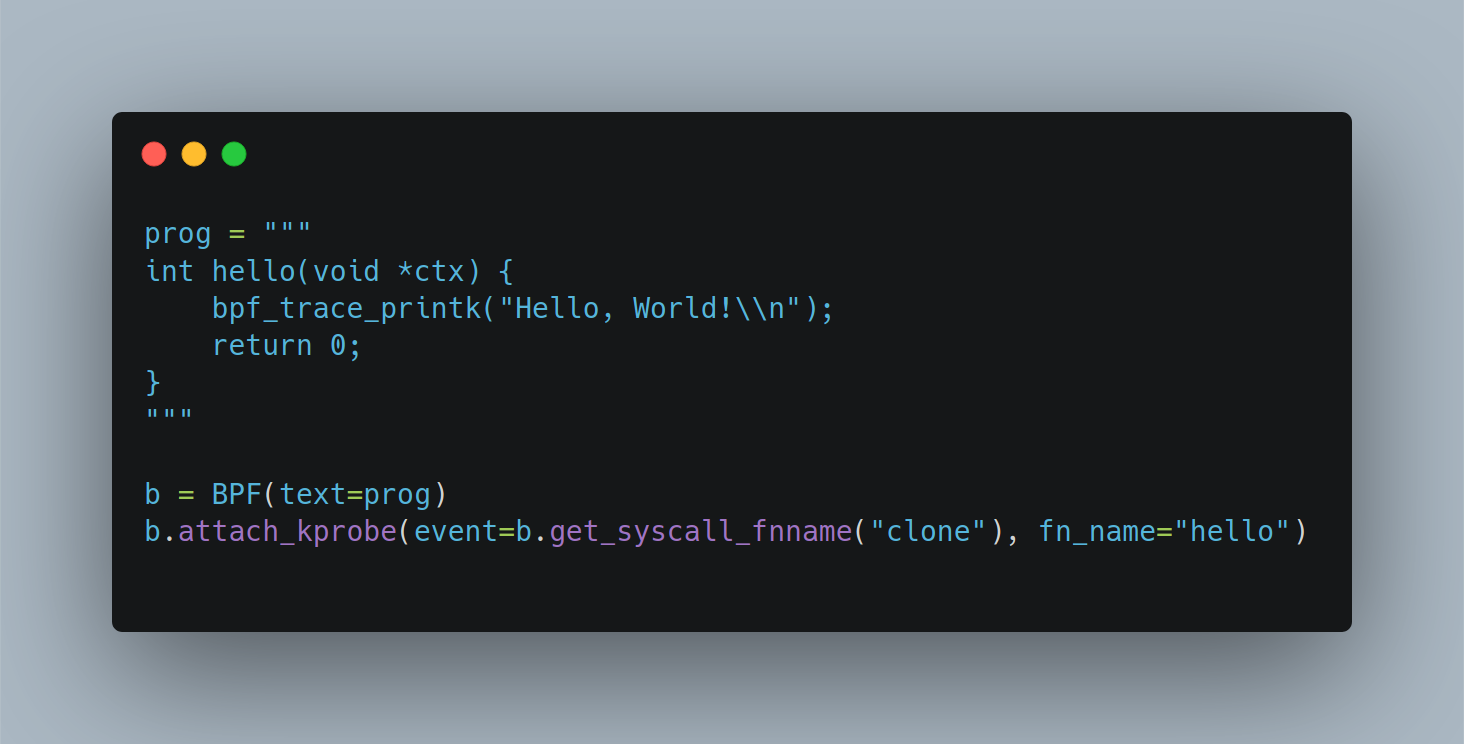
BCC also includes Python bindings that can be used to perform the front-end tasks, but also allows you to embed a BPF program as a string literal right in your Python script. This makes it fairly easy to see how BCC made it very easy to create BPF-powered tools to solve problems.
The BCC project itself also contains a solid collection of pre-built tools so that you don’t have to write your own - there’s a good chance someone already built a tool to solve your need, or close to it!
However, using BCC has some drawbacks, which are well-explained here and here but I’ll try to briefly summarize:
There are a lot of tools built on top of BCC, and there are a lot of BPF developers who are accustomed to these drawbacks and have workflows in place to minimize their effect. Not to mention BCC is more than just a framework for building BPF tools, it is also a useful collection of such tools. So in short - BCC isn’t going anywhere anytime soon.
However, these days there is broad consensus for directing eBPF newcomers to other options, which we’ll discuss in the upcoming sections. For this reason, the BCC Python bindings are considered deprecated, and while this will have a long tail, newcomers are being directed to use other, modern options. There is also a concerted effort underway to convert the pre-built tools within BCC to use libbpf under the hood.
Like BCC, libbpf is a framework for building BPF programs - you get a C library for not only compiling and loading BPF programs, but also the other “frontend” tasks we performed previously using BCC Python. However, it has some very significant differences with BCC:
libbpf, you’re more likely to be well-aligned with the changes going on all the time in the Linux kernel.However, because libbpf allows us to compile our BPF programs once and run it on a wide variety of linux kernel versions, it raises an interesting question, namely how to ensure our BPF program remains portable? After all, some BPF programs (particularly the tracing variety) access internal kernel structs, many of which can change drastically between kernel versions.
In researching for this post, I actually dug into this subject quite a bit, and as a result, was planning to go into a lot of detail in this section. However, this is a fairly technical subject that is pretty out of the scope of this post, and also well-covered by others. So, I’ve moved a lot of this research to another post that I hope to circle back on and finish when I have the time, ideally aimed at folks like myself that don’t have a huge kernel background. In this post, I’ll just briefly summarize how
libbpfsolves this problem, with some useful follow-up reading links.
libbpf accomplishes this with two new technologies:
libbpf as well as a set of enhancements to the Clang compiler that allow the resulting program to emit “field relocations” alongside the compiled program.For getting started with libbpf, you may want to take a look at the libbpf-bootstrap repository. It contains a few useful starting points and skeleton examples.
Even with the variety of tools available in collections like BCC, it’s quite possible that you have a use case that isn’t covered by one of these. However, you may not have the desire or skill to write your own BPF program from scratch.
This is where bpftrace may help - it’s sort of a middle ground between pre-canned tools and writing your own BPF program from scratch with BCC. It’s like awk for BPF - you get a lot of flexibility if one of the existing off-the-shelf tools don’t work for you, but it’s still opinionated enough that you don’t have to be a full-blown kernel developer to use it.
At the core of most BPF programs is the need to run some kind of custom logic in response to some event that takes place on a system. The types of events can vary greatly, and of course, the program that runs in response to events is entirely up to the use case and the developer of that program, but at the end of the day, that’s what it boils down to. With bpftrace, you can easily capture both sides of this equation in a simple one-liner. The bpftrace repository includes several examples, such as this one which lists file opens:
# bpftrace -e 'tracepoint:syscalls:sys_enter_openat { printf("%s %s\n", comm, str(args->filename)); }'
Attaching 1 probe...
snmp-pass /proc/cpuinfo
snmp-pass /proc/stat
snmpd /proc/net/dev
snmpd /proc/net/if_inet6
^C
Here, the bpftrace tool takes an expression, similar to how you might pass a filter expression into tcpdump. This expression specifies an event, specifically a tracepoint that is triggered when the syscall openat is invoked. In response, the program that follows is run, which simply prints the name of the program, followed by the filename that’s been accessed by that program.
In addition, bpftrace can interpret much longer programs - even attach different programs to multiple tracepoints, all within the same file. Conventionally, these have the .bt file extension, and you can find a lot of example bpftrace programs in the bpftrace repository.
#!/usr/bin/env bpftrace
/*
 * biolatency.bt	Block I/O latency as a histogram.
 *			For Linux, uses bpftrace, eBPF.
 *
 * This is a bpftrace version of the bcc tool of the same name.
 *
 * Copyright 2018 Netflix, Inc.
 * Licensed under the Apache License, Version 2.0 (the "License")
 *
 * 13-Sep-2018	Brendan Gregg	Created this.
 */

BEGIN
{
	printf("Tracing block device I/O... Hit Ctrl-C to end.\n");
}

kprobe:blk_account_io_start
{
	@start[arg0] = nsecs;
}

kprobe:blk_account_io_done
/@start[arg0]/
{
	@usecs = hist((nsecs - @start[arg0]) / 1000);
	delete(@start[arg0]);
}

END
{
	clear(@start);
}
Because of the shebang declaration at the top (#!/usr/bin/env bpftrace), you can set this file as executable and run it like any other program.
There is a lot of momentum behind bpftrace, not only because it makes it possible for non-BPF developers to have customized tracing tools, it also provides a useful way to stop re-inventing the wheel for every new use case. For simple to moderate tracing purposes, bpftrace can get you quite a ways down the road.
Some useful bpftrace links:
This post (in particular, the days of research that led into it) have clarified a lot of things for me, and while I definitely have more to learn, I am on much more solid ground now that I’ve disambiguated these three “core” projects, and I understand more about what to use for what purposes.
If you’re new to eBPF, here are some key takeaways:
bpftrace - it is a lot easier than writing your own BPF program but you still get a lot of flexibility.libbpf or one of the many libraries providing higher-level bindings. It is the future, and provides a much better development experience than was available in BPF’s early days.I encountered a TON of useful resources in my research, which I did my best to link above - but here are some others I may not have had a chance to get to: